Climate change and Oxford – a history and primer

On 26 January 1776, at just after ten past eleven in the evening, Dr Thomas Hornsby, Professor of Astronomy, walked back from his thermometers on the lawn of what is now Green Templeton College into his study.
He recorded the temperature carefully in his book - ‘16 2/3’, the temperature in Fahrenheit – a chilly minus 8.5°C, ‘FR’ for the frost that was forming, CL(ouds) & snow. Feeling the need for some inner warmth, he lifted his decanter, but what was that? His scientific instincts spotted the crystals and compelled him to record it: “wine beg(ins) to freeze in my study”.

What Dr Hornsby didn’t know is that 250 years later, his principles of carefully recording both measurements and techniques would continue on the same site, as well as in advanced weather satellites of exquisite precision providing global coverage. Nor that his measurements would be part of a baseline from which we measure a changing climate, enabled by his careful documentation.
Oxford, you may not be surprised, has been involved in climate science from end to end. We’ll come back to Dr Hornsby and his modern equivalents later. But the main purpose of this article is a comprehensible grounding in the science of climate change, as it underpins so many local, national and international issues today, from reservoirs to energy for... well, everything. We hope to leave more people with a better understanding of why the world is warming and why it matters.
A Frenchman, an Irishman and a Swede
We’ll start by following the story of climate science with three pivotal characters. They didn’t walk into a bar together, but they did teach us a lot about the atmosphere.
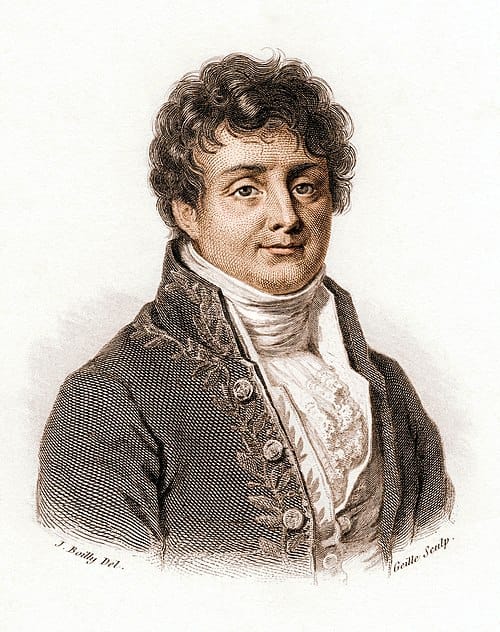
Our story begins just over 200 years ago, with the French mathematician Joseph Fourier. He was quite the overachiever, making several major advances in maths and physics, and was also recognised as a skilled politician. He calculated how warm the Earth should be, based on the energy arriving from the sun, and found the answer was a chilly -18°C – about 30 degrees lower than the Earth’s actual temperature. He set this out in his 1824 paper ‘Remarques Générales Sur Les Températures Du Globe Terrestre Et Des Espaces Planétaires’ (you can probably get the gist, even without a translation) and speculated that this might be because of extra radiation arriving from space (wrong) or the Earth’s atmosphere acting as an insulating blanket (very close).
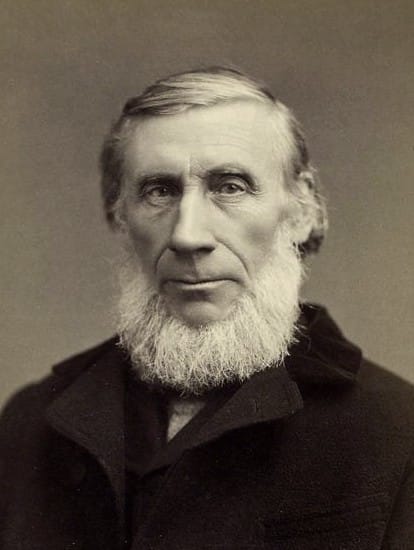
Our next character is John Tyndall, an Irish-born physicist with a track record that includes planning in the early days of the railways, and research into magnetism. But our focus is a set of experiments he conducted at the Royal Institution in 1859 that carefully measured how much energy different gases absorbed from heat radiation. This instrument was so sensitive that he showed in lectures that he could move the galvanometers (i.e. measure electric current) by pointing the thermopile (which converts thermal energy into electrical energy) at his assistant standing several feet away.
His measurements showed that water vapour is the greatest absorber of heat in the atmosphere, with carbon dioxide (CO2) making only a small contribution, just over a tenth. His original experimental apparatus is on display in the basement of the Royal Institution in London today, and shows the care and ingenuity of Tyndall and other scientists of his era in collecting data.

These days we often talk about practical or commercial spin-offs from scientific research, Tyndall’s spin-off from this work was a system for measuring the level of carbon dioxide in exhaled human breath. This same basic process is still used in hospitals today, to monitor patients under general anaesthetic.
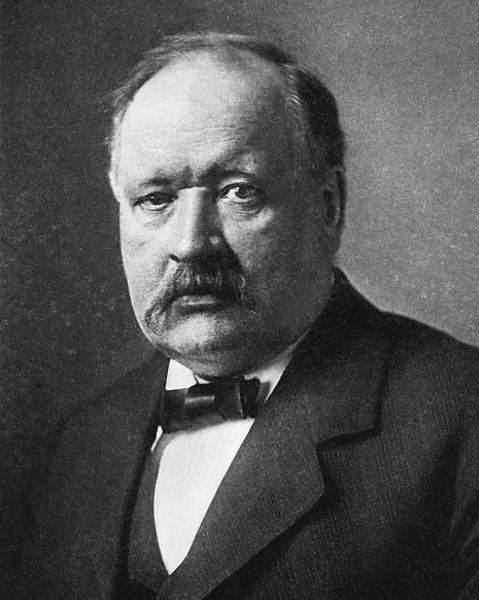
Our final friend is Svante Arrhenius, who apparently taught himself to read at the age of three. Most of Arrhenius’ work was in chemistry, for which he would win a Nobel Prize in 1903. But he also found time to study the absorption of heat in the atmosphere. Arrhenius was the first to realise that the carbon dioxide from the burning of fossil fuels could be big enough to affect the Earth’s climate: “The enormous combustion of coal by our industrial establishments suffices to increase the percentage of carbon dioxide in the air to a perceptible degree.” Starting with Fourier’s analysis and Tyndall’s data of gases, he then considered what happens if you changed the amount of carbon dioxide: “any doubling of the percentage of carbon dioxide in the air would raise the temperature of the earth's surface by 4°[C]”.
His calculation wasn’t perfect, because it didn’t include things like clouds, ice sheets and vegetation that change with the temperature and CO2 levels. But scientists’ current best estimates are that this number, the ‘Equilibrium Climate Sensitivity’, is between 3°C and 4°C. So Arrhenius was not far from the mark, over 100 years ago.
Look at the sky!
By now we’ve all heard about carbon dioxide, but what is actually happening to cause the heating?
What Tyndall and co worked out back in the 1800s is that most of the energy from the sun arrives as light we can see (with wavelengths of a few hundred nanometres for the technically-minded). Clouds permitting, this energy reaches the ground. (We should be glad that evolution arranged the eyes of our hunting ancestors to see through the transparent part of the spectrum.)
As the energy reaches the ground some gets reflected, but a lot gets converted into infra-red radiation (peaking at 10-20 micrometres). However, unlike for ‘visible light’, the atmosphere isn’t completely transparent to infra-red. The water vapour, carbon dioxide, methane and other gases in the atmosphere absorb it. And by ‘absorb’ we mean that the waves jiggle the atoms of these gasses around, heating them up. If you are like me, you may remember little balls with springs joining them, and the science teacher saying that jiggling the springs represented heat. Science teachers still say that hot things jiggle more, but the presentation has moved on…
This is broadly the same process as heating the food in your microwave oven, except that there the energy is generated in a magnetron rather than converted sunlight, and it’s absorbed mostly by water molecules in the food rather than water, carbon dioxide and other molecules in the air. It’s all the same basic science.
The more carbon dioxide and other gases there are in the atmosphere, the more that heat from the sun is likely to be trapped on its way out, and the more the planet warms up. (Like turning up the power on your microwave oven.)
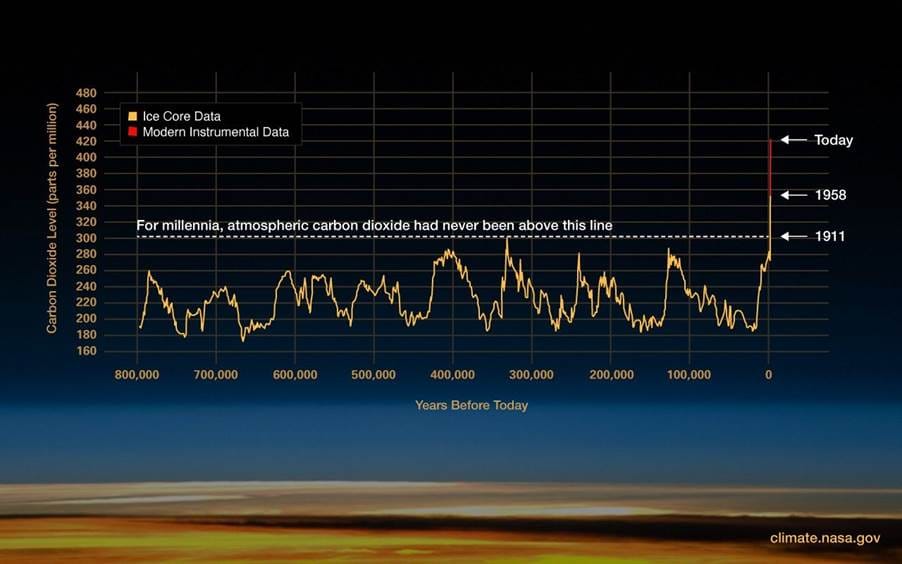
Before the industrial age, carbon dioxide levels in the atmosphere were driven by natural cycles and variability. They remained under 280 parts per million for at least 800,000 years, and significant changes to CO2 levels took many thousands of years. Then, in the late 1800s, people started burning fossil fuels in large quantities: coal, oil and gas, and CO2 levels started rising. Some has been absorbed by the oceans – things would be a lot worse without the oceans – but in the past 150 years carbon dioxide levels have risen from 280 to over 420 parts per million, an increase of over 50%.
There are many other effects happening. Some are too long-term to have an effect in the industrial age (such as cycles in the Earth’s orbit), some are regular cycles that average out over time (solar cycles and the El Niño / La Niña ocean cycles), some are random events that also average out over time (volcanoes), and some are linked to the climate itself and may amplify or dampen climate change (cloud formation, ice sheet melting, vegetation growth).
Some people will try to obscure or deny climate science by throwing these other effects into a discussion. It’s not always easy to refute these on the spot, whether in conversation or on social media, but climate scientists know which ones make a difference, and which ones don’t. The Scientific Method means that if you can prove something with solid evidence and reasoning then it will stick, but flaky claims will be dismissed. And we’ve seen how scientists are their own toughest critics, always seeking to extend their understanding of the world.
This is how climate science has developed and improved for more than 120 years since Arrhenius. By now the physics is clearly understood from the Earth’s orbit down to the sub-atomic level, but there are still unknowns. Climate scientists are essentially trying to forecast the weather for the whole world for the next 50 years, which – as you can appreciate – is inevitably difficult. But in the end, the biggest uncertainty is always ‘what are the humans going to do next?’.
What will happen on a warmer planet?
One certain thing is that the Earth will get hotter. Even if we ramp down emissions now, the emissions already in the atmosphere will continue heating us like a still-warm oven. That doesn’t mean there’s nothing we can do, it just increases the urgency of turning down the heat. And it is urgent – when people talk about a 2°C increase in global temperature, it’s easy to imagine just a slightly warmer version of yesterday’s world – but that’s not what it is going to be like.
First, an increase in temperatures makes hot extremes more likely. We’ll see more and longer heatwaves. The 2022 heatwave was estimated to have caused 65 extra deaths in Oxfordshire, but the impact of heatwaves in Southern Europe, Africa or Asia is even more severe. Dry land catches fire more easily, and we’ve seen more wildfires around the world and in the UK, even in February.
Rising heat causes more rain too. This may seem odd, but think back to a water cycle diagram – rain starts with the evaporation of water and more heat means more evaporation. What goes up, must come down, and so eventually that means more rain. But there’s a further twist. Warmer air will hold more water vapour before it rains, which is why we will also tend to see heavier rain events. As more rain falls, it also tends to fall on more waterlogged ground, meaning that twice as much rain creates much more than twice as much flooding. (We wrote about flooding in Oxfordshire in November 2024).
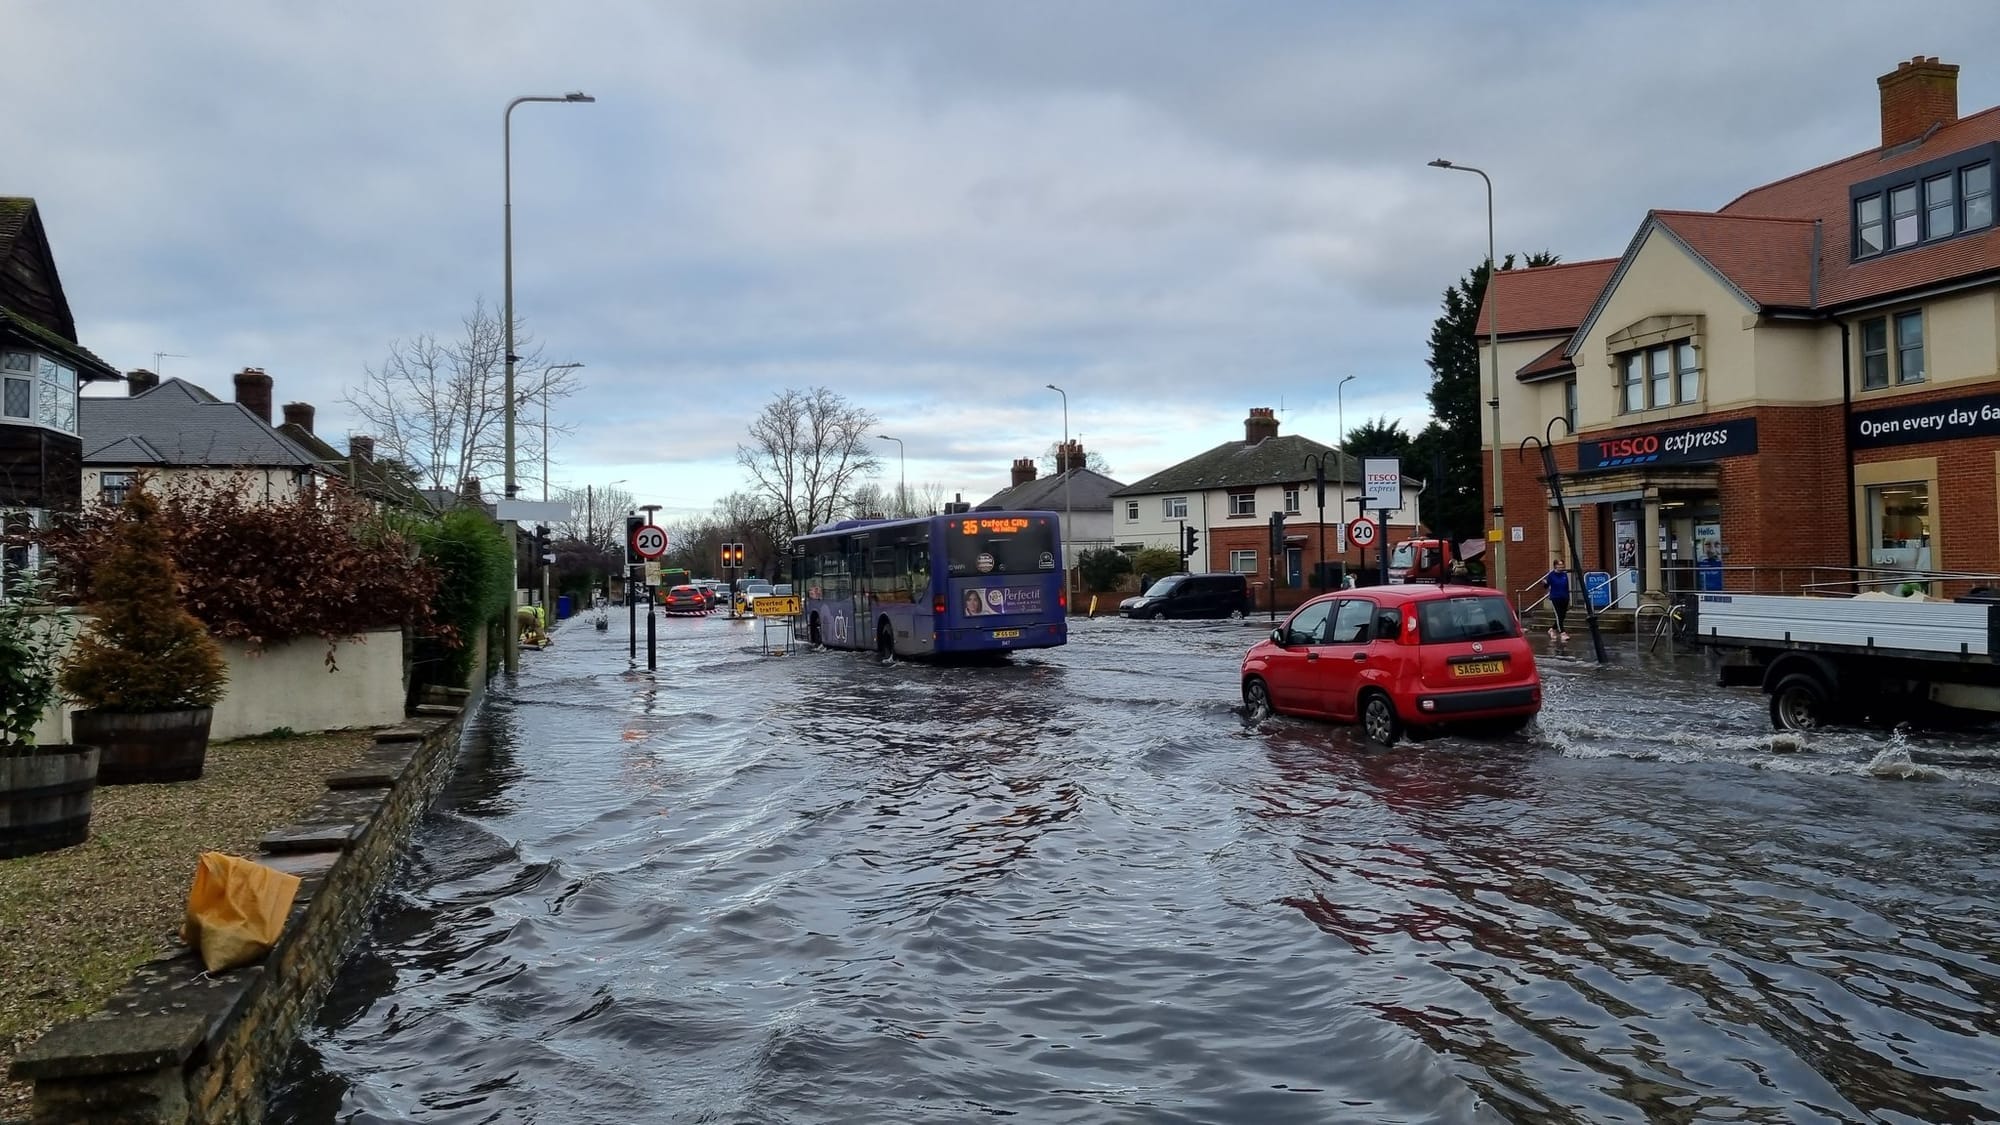
Sea levels are rising as well. Partly this is from melting ice caps, but mostly it is through the expansion of the oceans’ water as it gets warmer. Oxfordshire is probably safe from the sea for now, but millions of people worldwide live in low-lying coastal areas, from Norfolk to New York to Nigeria.
Finally, we can expect more weather extremes. The Met Office’s annual ‘State of the UK Climate’ report for 2024 shows that the hottest summer days are warming twice as much as average summer days; the Oxford Radcliffe Observatory recorded its wettest 2-day period in a near 200-year daily record in September 2024; and the unusual duration and direction of Storm Darragh in December 2024 are likely to have contributed to its severe impacts.
Does anyone benefit? If anyone, it would be a nation so famously cold that its winters stopped Napoleon and Hitler in their tracks, that has a huge interest in fossil fuel exports, and much to gain from defrosting its frozen plains. But who are we to put in that suggestion to the debate?
Back to Oxford
The Radcliffe Observatory and the Radcliffe Meteorological Station, sitting in the garden of Green Templeton College, just off Woodstock Road, boast the longest continuous weather record in the country. Initial observations were started by our Dr Hornsby in 1767. A continuous record of rainfall exists from 1772, with daily temperatures from 1813. Construction of the octagonal tower of the Radcliffe Meteorological Station, 33 metres high with its recognisable ‘ball’ on top, also began in 1772.
Why was an astronomer so interested in the weather? It’s because the atmosphere at different temperatures bends light slightly differently, and by the mid-1700s astronomy was sufficiently precise for this to affect measurements. Plus, he seems to have been a genuine enthusiast – when the weather was particularly wet or cold, he was taking more readings during a day. Present day scientists value Hornsby’s attention to describing his instruments and methods, as it improves their ability to interpret and calibrate his results.
Two academics have recently looked into the history of Dr Hornsby and the range of his activities. (That’s just the way it is in Oxford.) Dr Tim Burt and Prof Stephen Burt’s ‘Oxford Weather and Climate since 1767’ covers the topic in detail, from the history of observations in Oxford to local weather trends and extremes. There’s a presentation on YouTube about it, and you can even download the dataset (we did…).

The records show that it’s been getting hotter in Oxford. The 30-year moving average temperature is now 11.3°C, while in 1900 it was about 9.7°C. (Scientists use a 30-year period to consider longer-term climate effects rather than short-term weather.) It’s estimated that 0.2°C of the rise is the ‘heat island’ effect of the city, but the majority is human-caused climate change.
It’s getting wetter too, just as the science predicts. Annual rainfall varies, but from the mid-1800s to 2000, Oxford’s 30-year average annual rainfall stayed between 620 and 680mm. Since 2020 it has risen above that range and in 2024 it rose to its highest recorded level of 698m. Three of the six wettest years in the near-200 year record have happened in the last 20 years.

And in today’s weather forecast…
Bringing things right up to date, Oxford climate scientists have recently shown that modern weather forecasts can be used to show the impact of human-caused greenhouse gas emissions on extreme weather. “Weather forecasters could – and should – both warn people of extreme weather and explain how it is being affected by climate change,” says Head of Climate Science at Oxford’s Physics Department, Professor Myles Allen.
Climate scientists usually run models on a global scale. But by using high-resolution weather forecasting models, and running forecasts with and without the impacts of greenhouse gas increases, the models can predict extreme weather events and how human emissions affects them. In one example, “climate change expanded how much of the UK was impacted by storm Eunice and intensified the storm’s severity by as much as 26%,” explained Shirin Ermis, one of the Oxford researchers. They’ve also applied the approach to the US Pacific Northwest heatwave, estimated to have killed over 800 people in June 2021, finding that “human influence on the climate made this event at least 8 times more likely”.
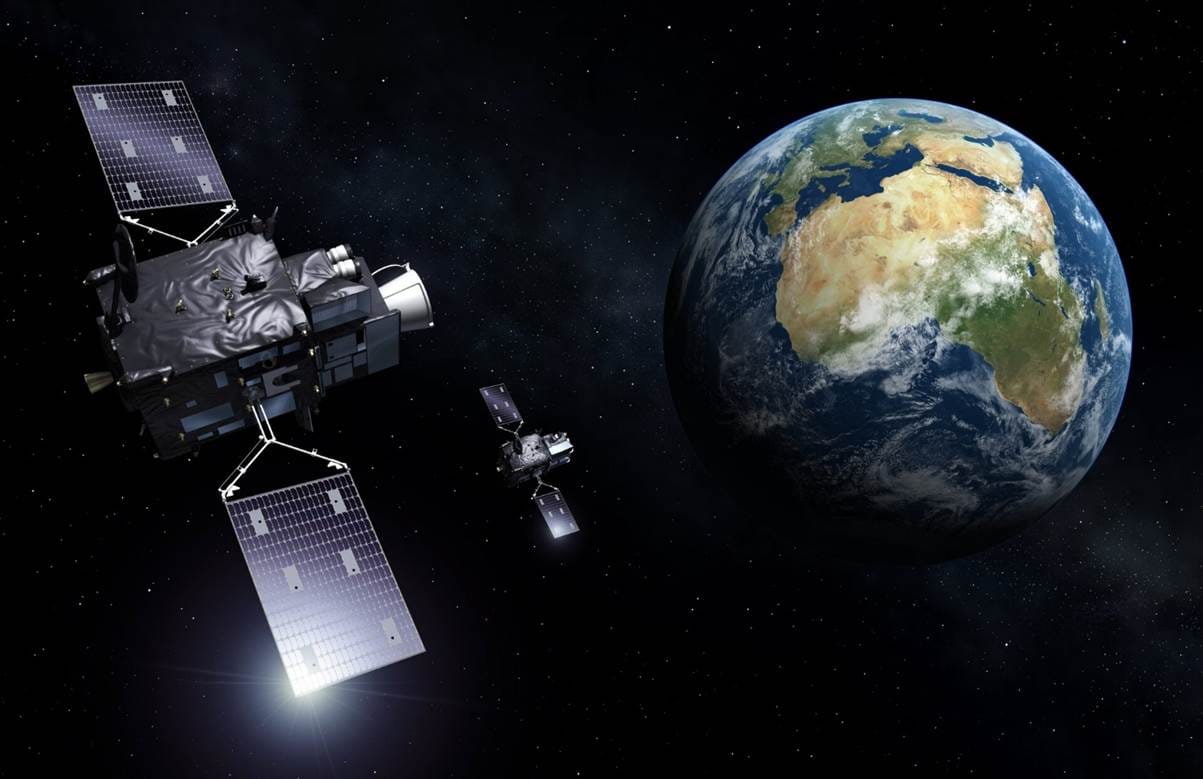
Take the ST1 bus to Harwell, and you’ll find RAL Space, the UK’s national laboratory for space science and technology. They have been involved in weather and climate monitoring satellites for decades and have a globally recognised expertise in calibration – making sure that if you think you measure 20.0°C from space, it is actually 20.0°C. Their latest contribution is to Meteosat Third Generation, the latest iteration of Europe’s premier weather satellite system since 1977.
This requires a calibration system that can be held at any temperature, from -180°C to +100°C, within 0.01°C for an hour, as the two imaging satellites hurtle round Earth at 7200 mph, 22,000 miles above the Equator. We think that Dr Hornsby, with his passion for method and accuracy, would have raised a glass of wine to that.

