Gentrifying Oxford vs the left-behinds
Oxford’s poorest areas are not sharing equally in the city’s increased prosperity, new figures suggest.
Parts of Minchery Farm, Rose Hill, and Wood Farm are now suffering more deprivation compared to 2015, while Littlemore, Northfield Brook and Temple Cowley have seen little change.
Meanwhile, areas of East Oxford towards the Plain, Florence Park, and Abingdon Road have gentrified rapidly with their deprivation score plummeting – and while Barton still has significant deprivation, the figures suggest this has greatly improved over 10 years.
The findings come from Clarion analysis of new deprivation data published by the Government at the end of October. The Government’s deprivation index combines factors such as income, crime, health and education to produce a national ranking, from the most deprived neighbourhood to the least. (The table divides England into 33,755 neighbourhoods of roughly equal size.)
Are the rich getting richer?
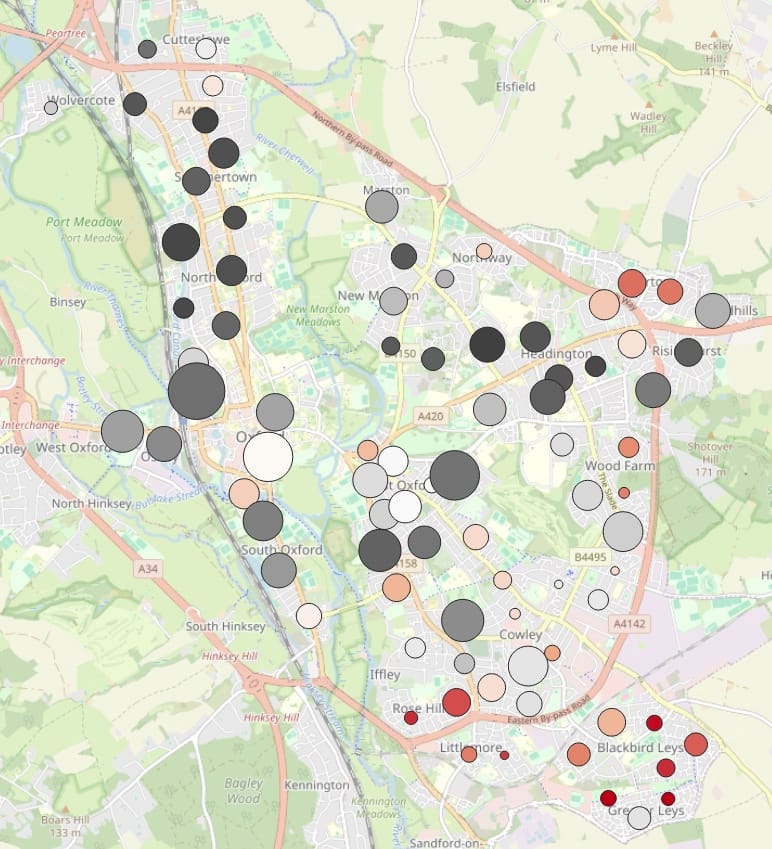
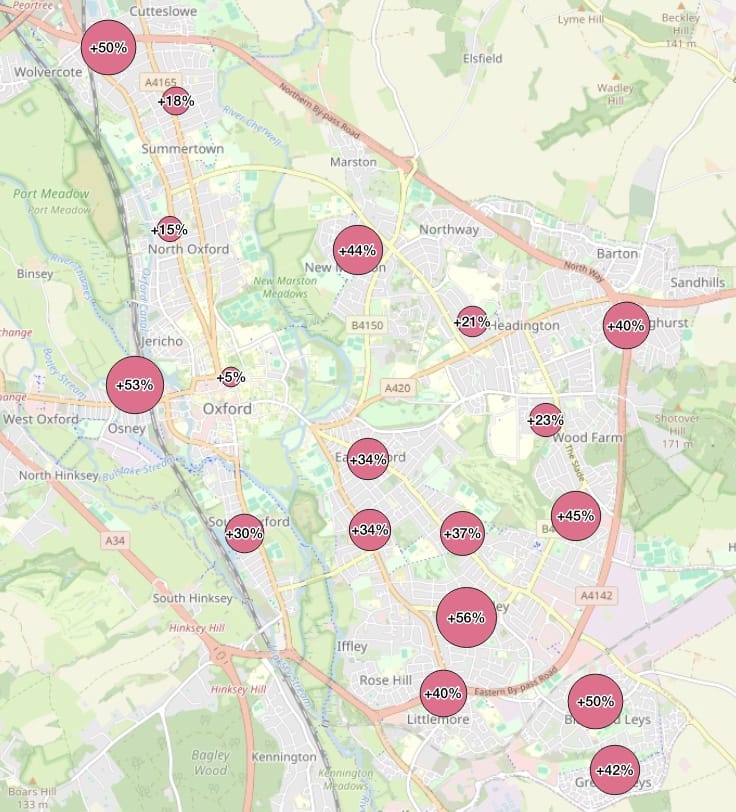
Our analysis compared the new data with figures from 2015. As you would expect, parts of Headington, Walton Manor, North Oxford and Summertown are among the least deprived in England. But we found that, over 10 years, they have become even less so.
Our map shows both national ranking of deprivation (colour) and change over the last 10 years (size):
- Red is high deprivation, white/grey medium, black low
- Small circles have seen deprivation increase or only slightly reduce over 10 years; large circles have seen deprivation reduced sharply
- So a small red circle means ‘high deprivation, little or no improvement’
- A large red circle means ‘high deprivation but significant improvement’
What are the headlines?
- Wealthy Oxford: Areas around Summertown, North Oxford and Headington have become even less deprived, typically dropping 4,000 places in the deprivation ranking. Sunnymead is now in 33,148th place of 33,755, putting it within the 2% least deprived neighbourhoods in England. Houses near the Headington end of Headley Way are 33,477th.
- East Oxford on the up: Florence Park has seen a startling drop in deprivation, from 19,985th to 28,776th – in other words, whereas once it rubbed shoulders with Cowley Airfield, it is now performing closer to Osney Island. Iffley Fields has improved similarly, from 22,464th to a Summertown-like 31,363rd.
- The most deprived neighbourhoods: But some poorer areas beyond the ring road have seen less upward mobility. The city’s most deprived wards are in the Leys, where the Northfield Brook neighbourhoods sit at 3,138th and 3,150th; the latter is actually a worse score than 10 years ago (3,553rd). So too Minchery Farm (now 6,007th most deprived, was 8,678th) and central Rose Hill (now 5,365th, was 6,182nd).
- Progress by the ring road: One bright spot is eastern Rose Hill, formerly the city’s most deprived ward (2,578th) and now greatly improved to 6,788th. There is real progress in Blackbird Leys, too, where the Sandy Lane area improved from 8,038th to 12,270th. Barton’s two neighbourhoods have improved from 4,722nd and 5,319th to 8,386th and 8,707th respectively.
(You can see the full data at the end of the article.)
Gentrification and house prices
Clues to the currents behind these changes can be grasped by looking at house price data.
Between 2005 and 2015, house prices soared in North Oxford – but were also sharply rising in up-and-coming areas of East Oxford. Areas around the Plain saw a 69% increase in this period, vs 40% in Greater Leys, 32% around Wood Farm, and 37% around the Abingdon Road.
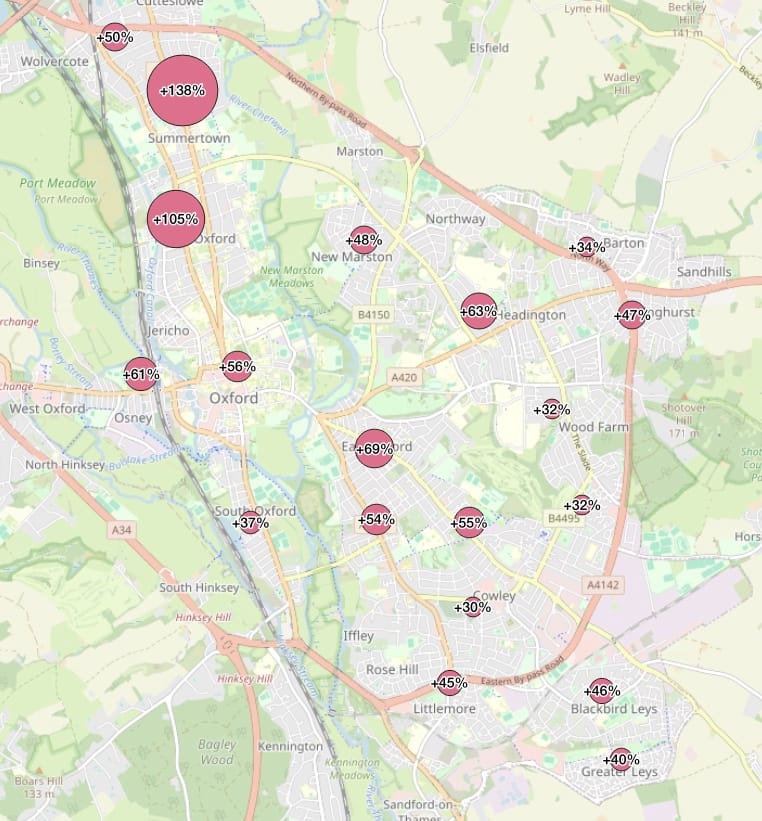
But since 2015, the trend has swung the other way. North Oxford and Headington prices have remained largely static. Prices near the Plain have slowed. The biggest rises have been further out, in Cowley and Blackbird Leys, as people are priced out of the centre – indeed, Cowley has gone from the smallest rise (30%) to the largest (56%).
The relationship between housing prices and deprivation is complex and not fully understood. On the one hand, high prices can be a sign of gentrification as more affluent workers colonise a poorer area; on the other, as residents are forced to spend more on their monthly rent and less on other essentials, deprivation increases.
A 2009 study reports that “One of the key features of gentrification is that areas can be deprived for long periods of time, but when change occurs, it is rapid”, and that “Neighbourhoods do not start to decline or gentrify until they pass some trigger point, but past the threshold, their status changes quickly.” So although rising property prices in East Oxford shadowed gentrification, particularly in the 2005-2015 period, it is not a given that Cowley and Blackbird Leys will follow suit.
Gentrification per se is not necessarily a bad thing. It is not our role (or the City Council’s) to judge one set of residents more deserving of housing than others. Bringing new money into an area can increase prosperity for existing residents, too. Oxfordshire’s most successful villages – and Oxford is a city of villages – are those with a mix of incomes, workers and retired, young and old.
Yet with demand outstripping supply, people are being priced out of the city. While the Green Belt remains in force, and commercial property (the ubiquitous ‘lab space’) lays claim to prime land, comparatively few houses are built on those scraps of land within the ring road. Most development is in the rural districts, far out beyond the Green Belt. As we reported in our Housing Week series, the pressure cooker of Oxford’s housing market is showing no signs of release.
Cllr Susan Brown, leader of Oxford City Council, says deprivation can be directly linked to house prices and supply.
“We know that one of the main drivers of poverty and inequality in Oxford is the high cost of housing in the city, with many families having to move out of Oxford due to rising costs. Oxford needs more genuinely affordable homes, particularly council homes, and through our housing company and our local government reorganisation proposals, we are working to address this.”
Social geographer Danny Dorling says that Oxford is “divided in its own special way”, with “some of the steepest social gradients found anywhere in Europe”:
“The Oxford I left as a child was mostly affordable. The price gap between neighbourhoods was measured in 1986 as being just a few thousand pounds and everyone in need with children qualified for a council house in the city. I came back to find a weird dystopia where the poor were being offered housing in Birmingham and oligarchs were rumoured to be purchasing around Park Town.”
What to do?
These headline figures mask a thousand individual stories. The observant will have noticed that our house price maps cover larger neighbourhoods than our deprivation map, an artefact of the source data. But even the latter neighbourhoods (typically 1000–2000 residents) are not homogenous. Research by Queen’s University Belfast in 2023 showed that the particular circumstances of smaller ethnic groups, often just a few hundred people clustered in one area, rarely show in official statistics. Green city councillor Chris Jarvis spoke to the Guardian at the time:
“There are small pockets of deprivation that have been left behind – they are not quite big enough to attract the big investment, but there are communities there that are really struggling.”
This “big investment” continues to happen. It is sporadic; a Government elected on a promise of ending wasteful competitive bidding, where councils compete for limited funding pots, has not yet changed its spots. Greater Leys has won the latest lottery, with £20m of ‘Pride in Place’ funding announced last month. This includes the Northfield Brook neighbourhoods that we highlighted on our map, now Oxford’s most deprived, and no better since 2015.
It’s not the only initiative intended to lift Oxford’s most deprived areas. The new-build community centre and 300 homes in Blackbird Leys is a classic, tried-and-tested regeneration scheme. September saw the opening of a Youth Hub to improve teenagers’ life chances.
Meanwhile, the biggest cheques of all are being signed for the Cowley Branch Line, the Ellison Institute of Technology in Littlemore, life science labs at the Ozone. All of these border on the areas of Oxford’s greatest deprivation. How will their arrival affect affordability and social cohesion – a rising tide that lifts all boats, or existing residents being priced out? Will Oxford, like London, become a city serviced by poorly paid manual workers exiled to remote suburbs and satellite towns, forced to commute longer and longer distances every year?
Oxford City Council has made much of its plans to rethink the Green Belt if it is given the keys to a unitary council, loosening Oxford’s straitjacket to build more homes. Whichever model is chosen, the councils of 2028 will have to face the same questions. Tackling deprivation in Oxford is not just about housing, but it is the biggest challenge of all.
Data sources and notes
- Index of Multiple Deprivation by Lower-layer Super Output Areas for 2015 and 2025. See deprivation maps and download raw data at deprivation.communities.gov.uk.
- Residential property sales by Middle-layer Super Output Areas from Office of National Statistics: 2025, earlier years.
- Centroids for MSOAs and LSOAs.
- A small number of LSOAs were merged or split between the 2015 and 2025 data releases. We have used the 2015 data as a baseline and attributed 2025 to the closest match.
- Oxford City Council’s press release reports their findings based on the new deprivation data, and says “A more detailed report on Oxford’s data will be published later this year.”
Full data
| Area | 2025 rank | Change from 2015 |
|---|---|---|
| Northfield Brook West | 3138 | ▽ 60 |
| Northfield Brook East | 3150 | 🔺 403 |
| Blackbird Leys Central | 3949 | ▽ 164 |
| Blackbird Leys South | 5311 | ▽ 1018 |
| Rose Hill | 5365 | 🔺 817 |
| Minchery Farm | 6007 | 🔺 2671 |
| Rose Hill East | 6788 | ▽ 4210 |
| Blackbird Leys East | 7538 | ▽ 2313 |
| Barton | 8386 | ▽ 3664 |
| Bayswater Road | 8707 | ▽ 3388 |
| Littlemore | 9025 | ▽ 20 |
| Wood Farm South | 9104 | 🔺 1542 |
| Blackbird Leys West | 9255 | ▽ 2732 |
| Wood Farm North | 9753 | ▽ 1746 |
| Cowley South | 11185 | ▽ 363 |
| Donnington | 12224 | ▽ 3837 |
| Blackbird Leys North | 12270 | ▽ 4232 |
| St Clement's | 12796 | ▽ 1886 |
| Barton End | 13809 | ▽ 4627 |
| St Ebbes by the River | 14275 | ▽ 4469 |
| Northway | 14295 | ▽ 74 |
| Cowley Marsh South | 15121 | ▽ 1161 |
| Cowley Marsh North | 15275 | ▽ 3166 |
| Horspath Road West | 15347 | 🔺 2412 |
| Temple Cowley | 15392 | 🔺 1375 |
| Church Cowley South | 15663 | ▽ 3768 |
| Headington Quarry | 15934 | ▽ 4180 |
| Cutteslowe Wall | 16297 | ▽ 1731 |
| Cold Harbour | 17032 | ▽ 3181 |
| St Aldates | 17697 | ▽ 10853 |
| St Mary's | 18961 | ▽ 5886 |
| Manzil Way | 18994 | 🔺 52 |
| South Park | 19112 | ▽ 4643 |
| Cutteslowe | 20235 | ▽ 1982 |
| Iffley | 20637 | ▽ 1573 |
| Crescent Road | 20657 | 🔺 2373 |
| Fern Hill Road | 20686 | ▽ 1872 |
| Cowley Airfield | 21173 | ▽ 7970 |
| Greater Leys | 21382 | ▽ 2560 |
| Herschel Crescent | 21646 | ▽ 3283 |
| Town Furze | 21782 | ▽ 2733 |
| East Oxford | 22032 | ▽ 6165 |
| Lye Valley | 22527 | ▽ 4657 |
| Jericho North | 22757 | ▽ 4811 |
| Bullingdon Road | 23163 | ▽ 4919 |
| Horspath Driftway | 23597 | ▽ 8217 |
| Lower Wolvercote | 23928 | 🔺 555 |
| Church Cowley | 24935 | ▽ 1636 |
| Gipsy Lane Estate | 25108 | ▽ 5777 |
| New Marston | 25549 | ▽ 4282 |
| The Lakes | 26270 | ▽ 735 |
| Sandhills | 26438 | ▽ 5986 |
| Old Marston | 26949 | ▽ 5576 |
| Holywell | 27249 | ▽ 7170 |
| New Botley | 27483 | ▽ 8833 |
| Hinksey Park | 27935 | ▽ 5996 |
| Florence Park | 28776 | ▽ 8791 |
| Osney | 28824 | ▽ 6067 |
| Whitehouse Road | 29499 | ▽ 8033 |
| Quarry Hollow Park | 29885 | ▽ 5981 |
| Robin Hood | 30176 | ▽ 5308 |
| Divinity Road | 30292 | ▽ 10918 |
| Five Mile Drive | 30415 | ▽ 595 |
| Jericho South | 30540 | ▽ 13682 |
| Norham Manor | 31038 | ▽ 3789 |
| Iffley Fields | 31363 | ▽ 8899 |
| Summertown West | 31452 | ▽ 4177 |
| Highfield | 31486 | ▽ 6466 |
| Risinghurst | 31492 | ▽ 3601 |
| Headington Hill | 31549 | ▽ 2517 |
| Wadham Park | 31860 | ▽ 687 |
| Cherwell Drive | 31949 | ▽ 2944 |
| Upper Wolvercote | 32082 | ▽ 2399 |
| New Headington | 32135 | ▽ 4113 |
| Old Headington | 32195 | ▽ 5039 |
| Park Town | 32433 | ▽ 4832 |
| Summertown East | 32471 | ▽ 4377 |
| Margaret Road and Windmill | 32916 | ▽ 1968 |
| Walton Manor | 32929 | ▽ 1504 |
| Frenchay Road | 33049 | ▽ 7199 |
| Sunnymead | 33148 | ▽ 3378 |
| Headley Way South | 33477 | ▽ 5935 |
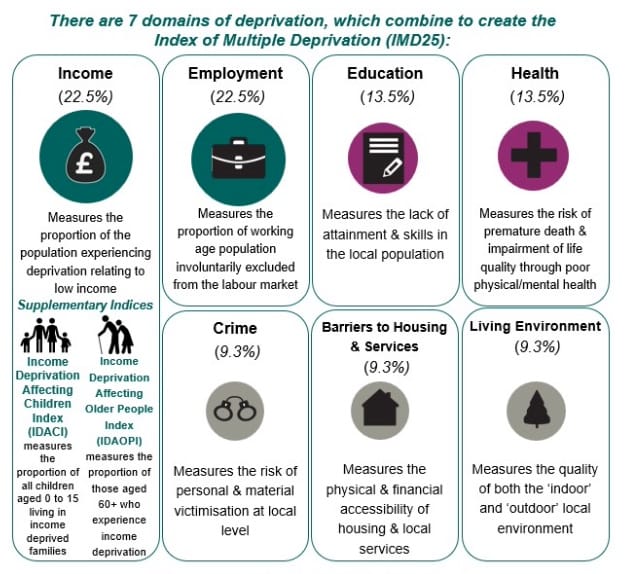
🔺 indicates more deprivation than 2015, ▽ indicates less deprivation. Neighbourhood names are Clarion approximations for illustration only and are not part of the source data. This infographic explains the constituent parts of the Index of Multiple Deprivation: