
Oxford’s elections 2025: the battlegrounds
With 100 days to go, voter analysis by the Oxford Clarion suggests that Labour face severe challenges in Oxford in the county council elections on 1 May.
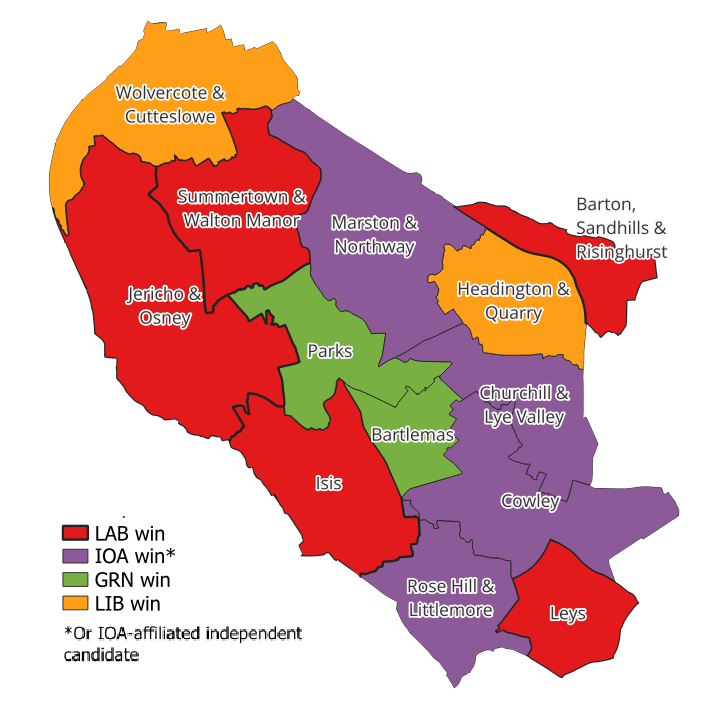
If the voting for last year’s city council elections was replayed at the county elections, Labour would win just five divisions of the 13 in Oxford itself. At the previous county elections, in 2021, Labour won 11 divisions of 14. (Boundary changes mean that Oxford has one fewer division this year compared to 2021.)
As a percentage of the total, the difference is stark: Labour won 79% of Oxford divisions in 2021 against a projected 38% this year.
Duelling geographies
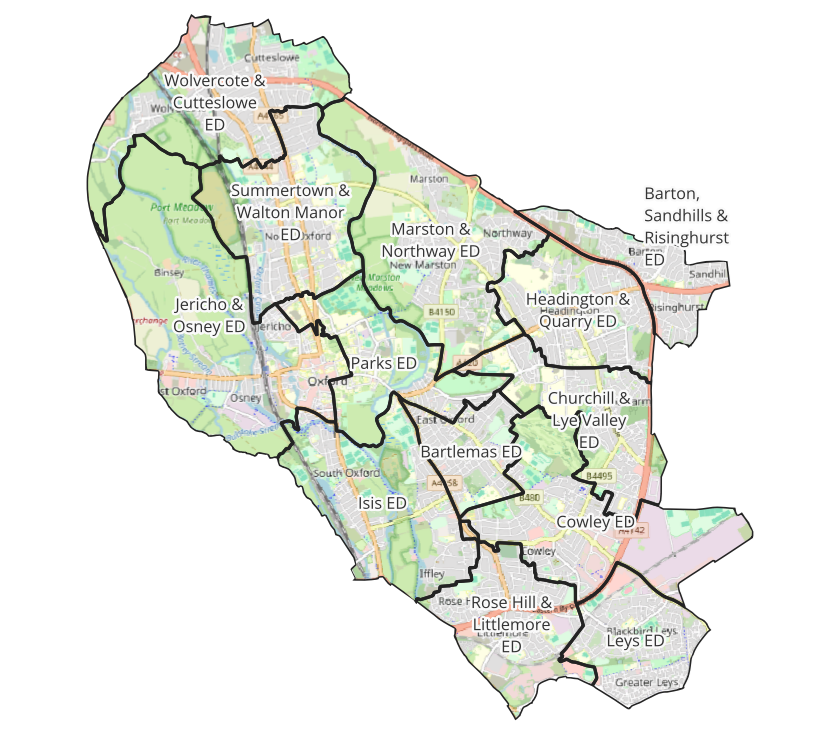
The projections come from a dissection of the May 2024 city council election results. City council electoral boundaries (‘wards’) do not overlap county council ones (‘divisions’). A county council division is about 1.5 times the size of a city council ward. And a single city council ward often overlaps different county council divisions.
To translate the city council vote results into county council divisions, the analysis breaks city council wards into separate chunks that fall exclusively into one division. Using satellite data on population density, the ward votes are apportioned to these separate chunks proportionately. These chunks are reassembled into the county division boundaries, whereupon the votes for each party are summed. It is these sums that provide projections for May 2025.
Greens to the left of me, IOA to the right…
Sources close to the Labour Party in Oxford have revealed to the Clarion that the party undertook a review of the electoral landscape in the aftermath of a difficult result in May 2024’s city council elections. Oxford Labour failed to win an outright majority for the first time since 2008.
The 2024 Oxford City Council elections saw a barnstorming performance from the Independent Oxford Alliance (IOA). This group’s main electoral offering was a promise to roll back the Covid-era Low Traffic Neighbourhoods in Oxford and to oppose further restrictions on car usage in the city – in particular, the traffic filters that Labour councillors voted for in November 2022.
According to the source, the Labour review identified that the party had to take a clear position on such restrictions: either to back them or reject them. The party decided to do the latter, suggesting they feel a greater threat from the IOA than from the Greens or Liberal Democrats.
The Clarion’s voter analysis projects Labour to come second place to the IOA (or IOA-allied independents) in four divisions in Oxford, while coming second to the Greens in two divisions.
Battlegrounds
The difference between first and second place is under 100 votes in five divisions where Labour is projected to come either first or second. These are its battlegrounds.
- Churchill & Lye Valley: the IOA take this with fewer than 50 votes, with 38.6% to Labour’s 37.3%
- Leys: Labour are forecast to hold on with 42.7% against the IOA’s 39.5%, a margin of under 60 votes
- Marston & Northway: another very narrow IOA win, with 30.9% to Labour’s 29.8%
- Parks: the closest contest of all, the Greens take this with 35.2% to Labour’s 35.1% – a margin of just two votes
- Summertown & Walton Manor: Labour is forecast to win from the LibDems with 27.2% to 26.7%
In a further two divisions, Labour’s win or loss is by fewer than 200 votes. These are Rose Hill & Littlemore, where it loses to the IOA, and Barton, Sandhills & Risinghurst, where it beats the IOA.
But if Labour pitch for IOA voters directly, these margins ostensibly fall by half: you only need to convert half (plus one) of your opponent's voters to your side to swing the election. Hence the vote ‘margin’ is half of the vote difference, plus one.
No other divisions have such close calls; the Greens are second to Labour, by some distance, in Isis and Jericho & Osney. Labour is projected to be a winner or a second-place-finisher in every single division where the difference between first and second is within 200 votes. There are no (for example) Green vs IOA showdowns.
Technical note: The voter analysis had to impute the IOA's results in a number of city wards where the party did not stand a candidate in 2024 and where no IOA-allied independent candidate stood. (The IOA has stated it will stand a candidate in all county divisions in Oxford plus a clutch of others in the county.) It furthermore had to hypothesise the number of votes that the putative city council IOA candidate would have taken from other parties.
Will it happen?
This analysis is not a forecast (what will happen in May) or even a ‘nowcast’ (what would happen if the election was today).
Rather, it’s a projection solely based on 2024’s city council results. A year is a very long time in politics, and voters’ minds may have changed – or may yet do so. Boundary changes mean that many residents won’t see familiar names on the ballot paper. Several incumbents are not standing again, while some sitting councillors could move to more winnable seats elsewhere in Oxford.
The streets of East Oxford are already resounding with the noise of leaflets through letterboxes as the parties, particularly Labour and the Greens, make their case for May’s elections. Residents can expect a barrage over the next 100 days. Being an activist has never been more important.